Share of the search funnel, weekly
Purchases, cart adds, clicks, and impressions — yours against the market's, per keyword, as a time series. The chart your Monday meeting starts with.
Real impressions, clicks, cart adds, and purchases for every keyword you compete on — reported by Amazon itself, tracked as market share over time. Not scraped. Not modeled. Not ±27%.
Every estimate-based tool reverse-engineers your sales from a sales-rank scrape. Independent benchmarks put those estimates at 73–79% accuracy. 1stPage reads the funnel Amazon reports to brand owners — query by query, week by week.
A REAL SELLER, A REAL MONTH. THE ESTIMATE MISSED BY 86%.
Every organic position you earn is traffic you stop paying for. 1stPage shows where you rank on every keyword that matters — so you spend ad budget on the gaps, defend the positions you own, and prove the climb to page one.
Then SEO Analytics scores the listing against 10+ A9 factors — title, bullets, images, pricing, reviews — and tells you what to fix to keep climbing. Diagnose, act, measure. One loop.
Explore keywords & rankVela reads the same first-party Amazon data the rest of 1st Page runs on — your real sales, ads, keywords, and inventory — and answers your questions in plain English. Deeper than a dashboard, and honest to a fault: she cites the actual number, shows the query she ran, and tells you when the trend is bad. Insight you can put a decision on.
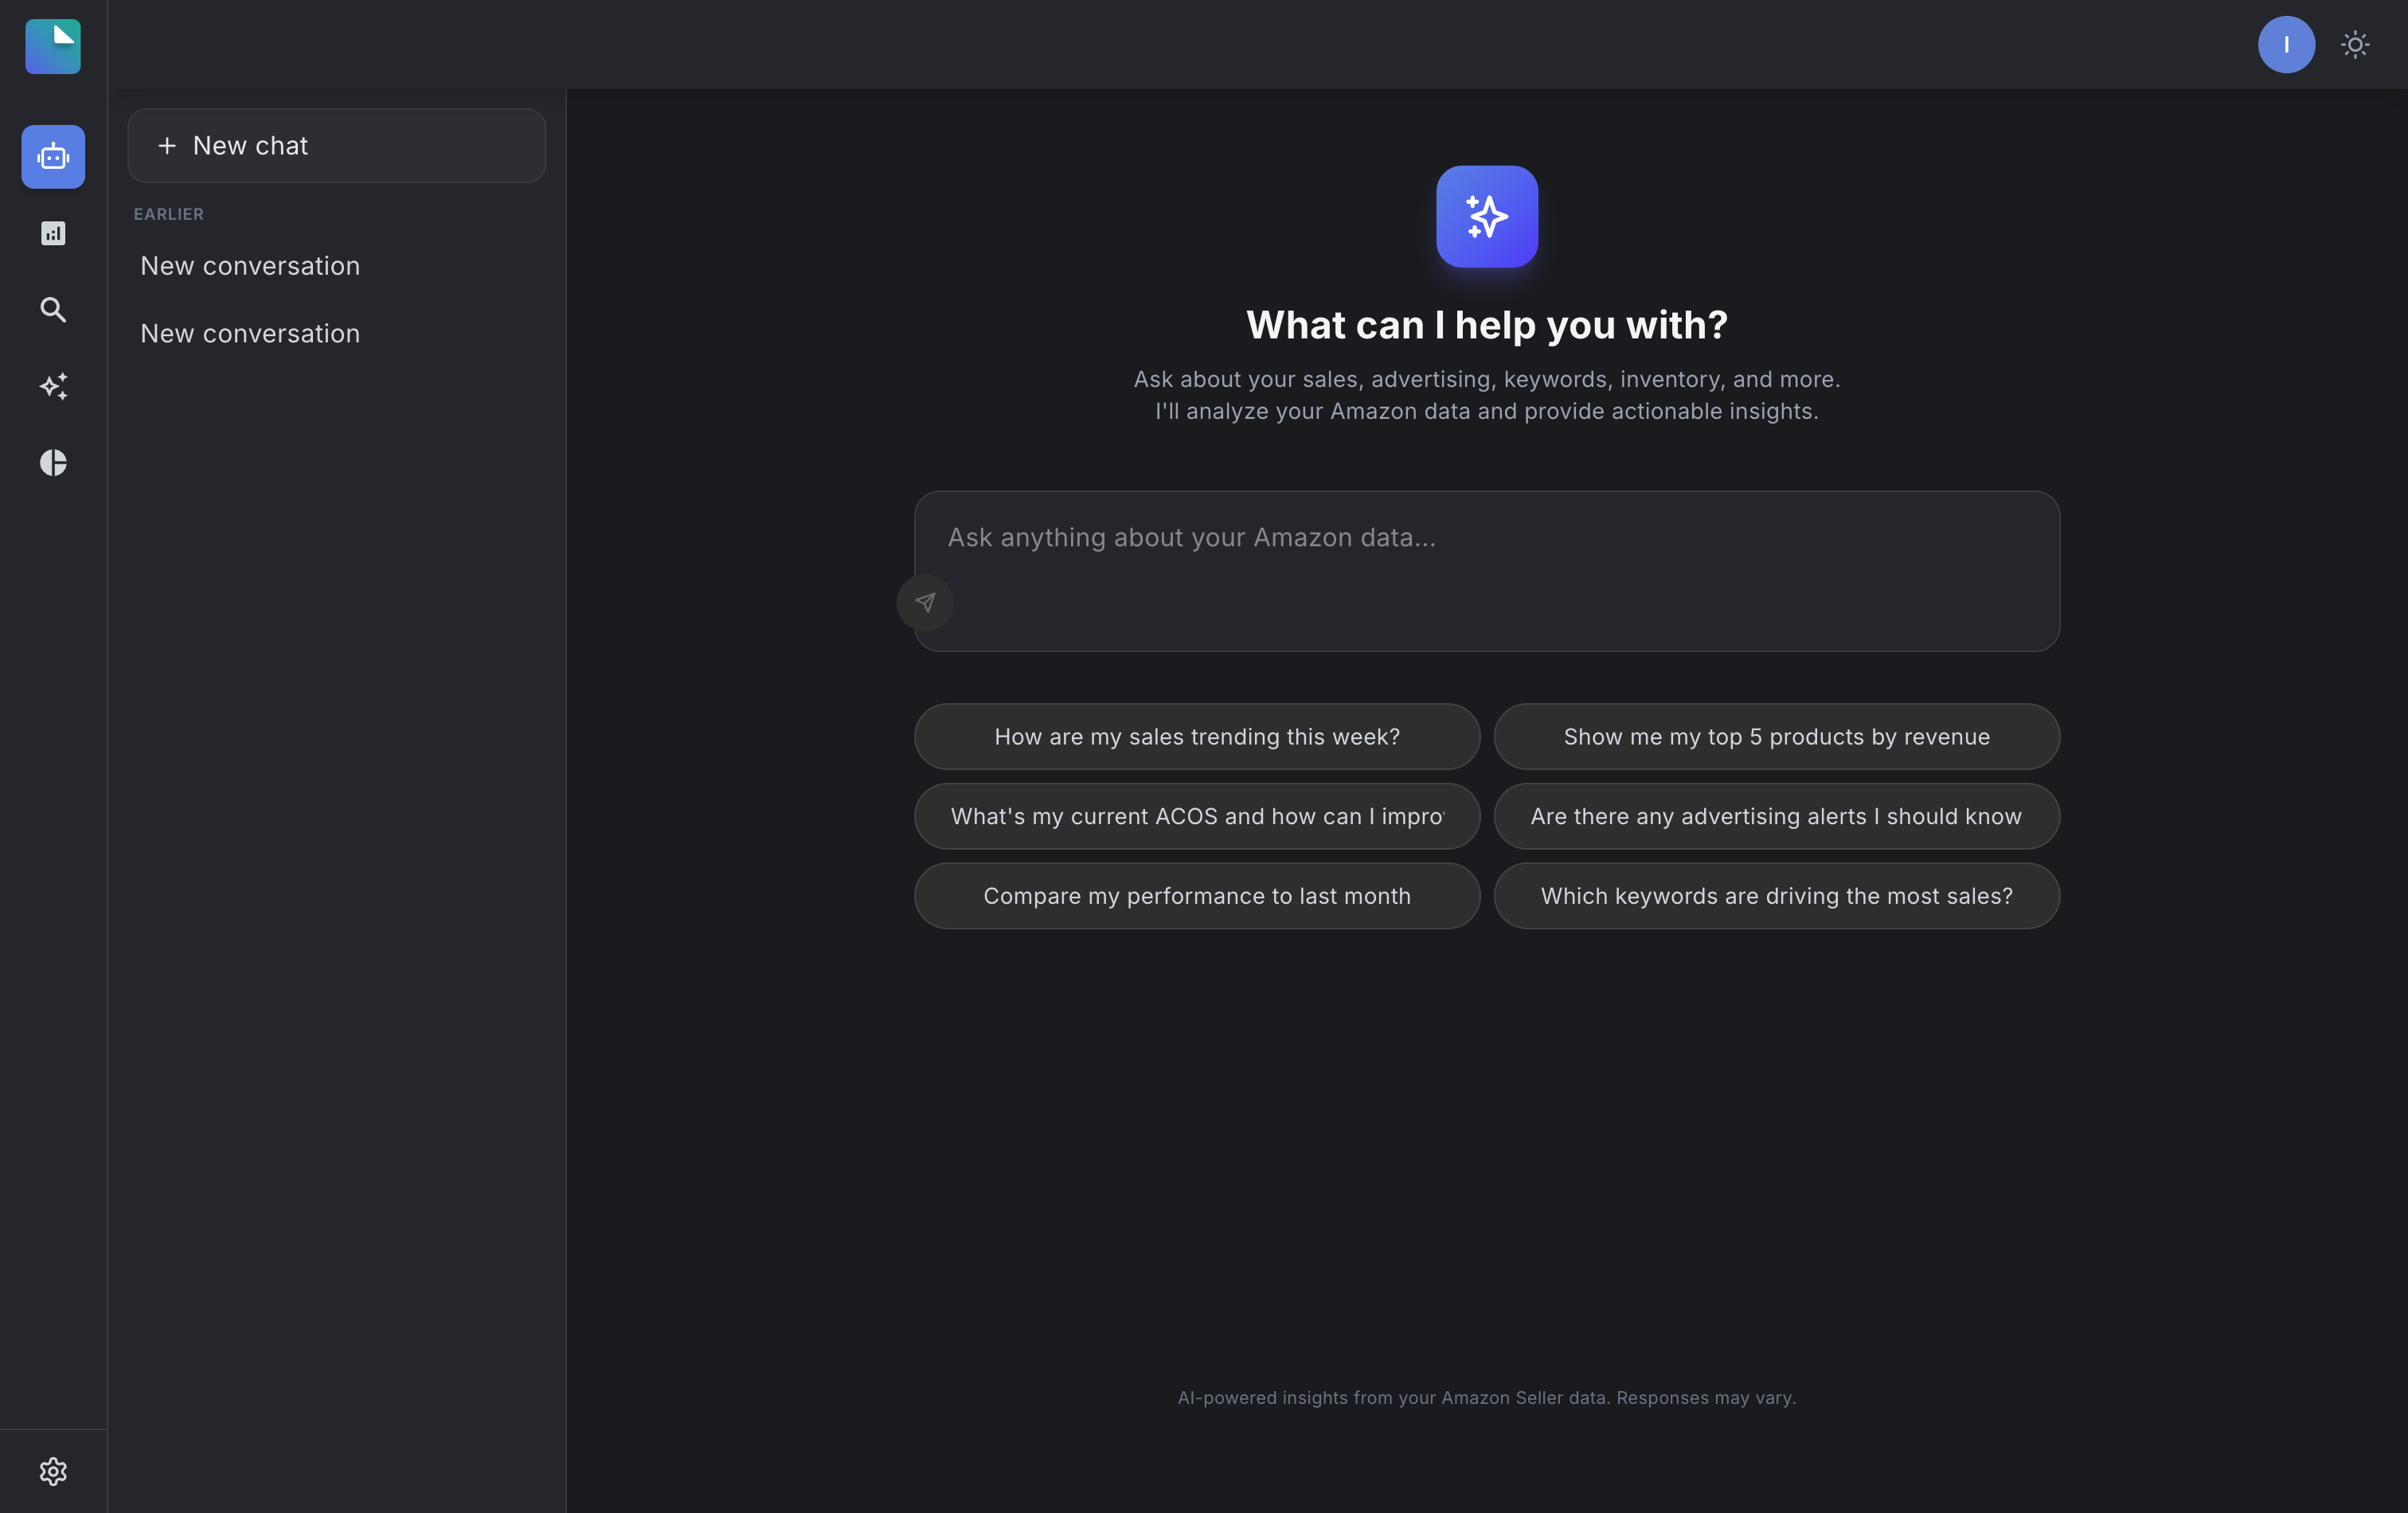
VELA · ASK ANYTHING ABOUT YOUR AMAZON BUSINESS, ANSWERED FROM YOUR ACCOUNT
Vela runs real queries across every table — sales, ads, keywords, inventory — and connects what a single chart can't show you on its own.
Every answer is grounded in your actuals, cites the figure it read, and flags what's thin or slipping. The estimate tools guess with confidence — Vela tells you the truth.
Ask the way you'd ask an analyst who knows your account, and get the move — with the math behind it — not another chart to interpret yourself.
SELLER + VENDOR CENTRAL · US UK DE CA JP + 5 MORE MARKETPLACES · TEAM ROLES
See where the sale leaksPurchases, cart adds, clicks, and impressions — yours against the market's, per keyword, as a time series. The chart your Monday meeting starts with.
Every listing graded against 10+ A9 factors — title, bullets, images, price, reviews — with the fix that moves the position. Diagnose, act, measure.
Sourcing share, inventory health, ordered vs. shipped revenue. The tooling ecosystem forgot vendors. We didn't.
Spend, ACOS, and TACoS by channel — read next to organic share so you can see what ads are actually buying you.
Every analytics tool exposed over an authenticated API. When your workflow runs on agents, 1stPage is the data layer they read.
Every reporting tool shows sales and ad spend — data your client already owns. None of them carry the two numbers that prove your work compounds: organic position and market share.
1stPage was built inside an agency. Multi-client, role-based, every marketplace, seller and vendor accounts side by side. Stop pasting screenshots into decks. Send the climb.
See the agency breakdown“We replaced a spreadsheet, a rank tracker, and a $500 add-on with one login. Client QBRs open with the share chart now.”
Start with 20 days of full access, free. Then two plans — no contact-sales wall.
Get full access to our platform for 20 days.
Get essential insights to track profitability and sales performance.
Unlock deeper analytics with advanced sales and market data.
FOR REFERENCE: THE ENTERPRISE TOOLS ANSWERING THIS QUESTION BILL $6,000–$120,000/YR.
Connect your account. Your first real market-share report lands within 24 hours.